Live Debugger
Debug your YAML call flows in real time — no extra setup required.
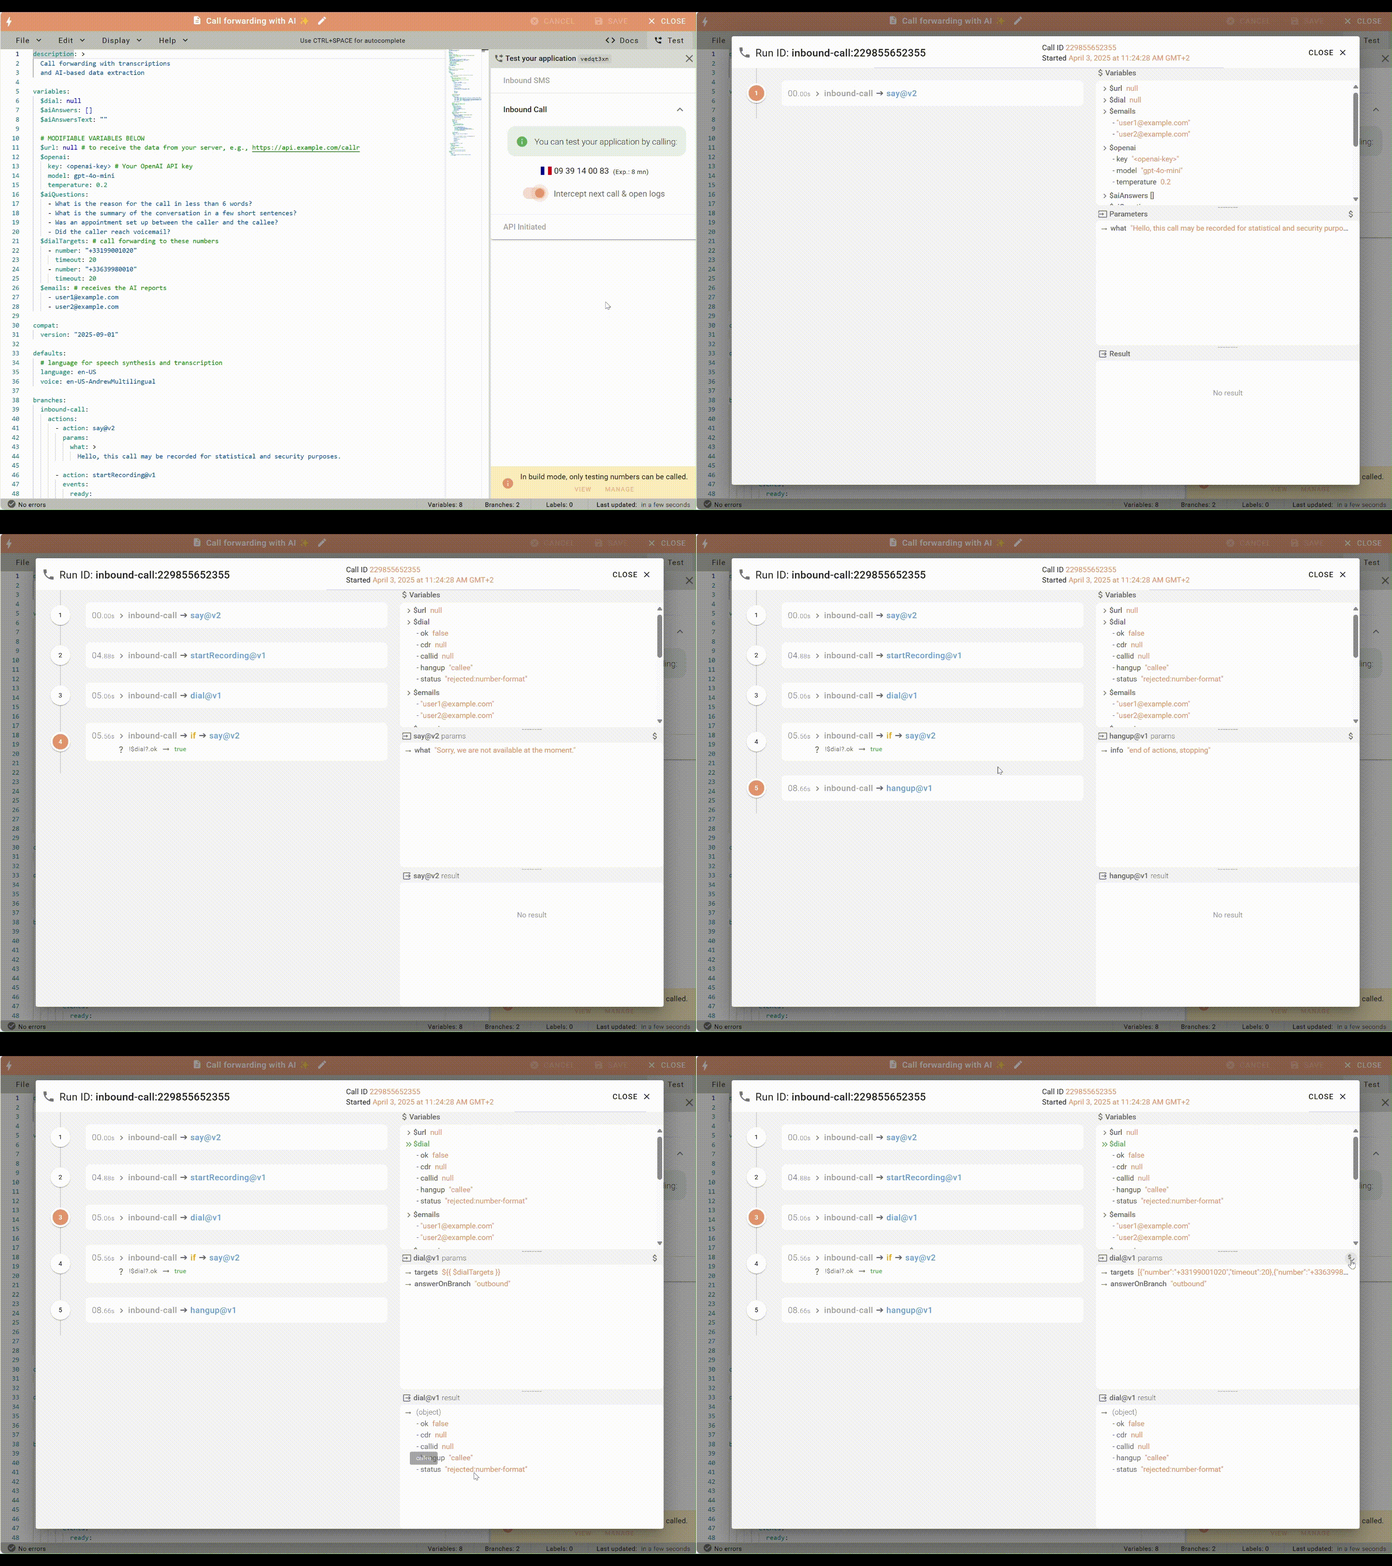
The Live Debugger is built into the Callr Actions editor and shows you everything that happens during a call or SMS event: variables, actions, branches, conditions, errors, and even AI responses.
🎯 What You Can See
As your flow executes, the debugger shows:
- ✅ Which branch is triggered (
inbound-call,api-initiated,hangup, etc.) - ▶️ Each action in real time
- 🔄 Input and output values for every action
- 📦 Variables at each step, including diffs (bold when modified)
- ⚠️ Errors, timeouts, or conditions that failed
It’s like console.log() — but for your phone flows.
🧪 How to Use It
- Open any scenario in Callr Portal
- Click the Test tab on the right
- For Inbound Calls:
- If you're in Build Mode, click “Assign Temporary Number”
- Toggle “Intercept next call & open logs”
- Call the number — the debugger will open and stream live events
- For API-initiated scenarios:
- Click Start Action
📷 See it in action:

Works for every type of flow!
🔍 What Happens Behind the Scenes
Each action that runs during your flow appears instantly in the log pane:
- 🧠 Conditional logic is shown (whether true or false)
- 📤 Payloads to APIs (
fetch@v2) are displayed - 🗣️ TTS and STT content is logged
You can copy variables or replay scenarios based on captured data.
🧰 Common Use Cases
| Scenario | How the debugger helps |
|---|---|
Troubleshooting failed fetch@v2 | See full request + response |
| Debugging AI call analysis | View prompt + raw LLM output |
| Dynamic variables not working | Inspect step-by-step values and conditions |
| Caller flow not reaching a branch | See which condition or action blocked it |
Unexpected sms@v1 or email@v1 | Check whether the number or address was valid |
Updated 3 months ago
